DiscardLess Atlas [on line]. 2017. Guitton J., Ulrich, C., Vermard Y., Afonso P., Andonegi E., Argyrou I., Calderwood J., Fauconnet L., Quetglas A., Morato T., Prellezo R., Robert M., Savina-Rolland M., Triantaphyllidis G.,Vaz S.
http://www.discardless.eu/atlas/
DiscardLess will help provide the knowledge, tools and technologies as well as the involvement of the stakeholders to achieve the gradual elimination of discard.
This atlas is part of the Discard Mitigation Toolbox that DiscardLess will produce.
Data Sources
For the Atlantic (ICES AREA)
The data used in this atlas are all publicly available. Data on effort and catch are those from the STECF Fisheries Dependent Database (FDI), which are described in the
annual reports. The data can be downloaded from
https://stecf.jrc.ec.europa.eu/data-dissemination. The data are provided by European Member States through a data call.
Although the data and indicators presented in STECF website have been produced after extensive data validation procedures by JRC and assessment by STECF, no warranty is made regarding the quality and completeness which is under the responsibility of the Member State.
Data on stock assessement in North East Atlantic area come from the ICES
Stock Assessment Database
For the Mediterranean and Black Sea
As for the Ices Area, data used are all publicly available. Data on catches and discard can be downloaded from
STECF dissemination tool . The data are provided by European Member States through a data call.
Although the data and indicators presented in STECF website have been produced after extensive data validation procedures by JRC and assessment by STECF, no warranty is made regarding the quality and completeness which is under the responsibility of the Member State.
Data on Stock assessment in Mediterranean Sea come from
STECF or
GFCM website.
Discards data fills in
The estimation of fisheries specific international landings and discards is based on linking the information about
fisheries specific discards and catch and discards at age among countries and replacing poor or lacking values with aggregated information from other countries.
Reported data by country are aggregated by fisheries and raised to the officially reported landings or discards in the format stipulated in the annual DCF fishing effort data calls.
A similar format had been designed by ICES SGDFF 2004 (ICES 2004) format. Fisheries definitions are based on area, year, quarter, gear, mesh size groups, special conditions as defined in Annexes
IIA-C of the annual fishing opportunities regulation or the multiannual management plans, and national fisheries (metiers) definitions.
More details on estimation of discard rates by fisheries and raising of discard for non-sampled fisheries can be found in the
Fisheries dependent working group report
Data Gathering
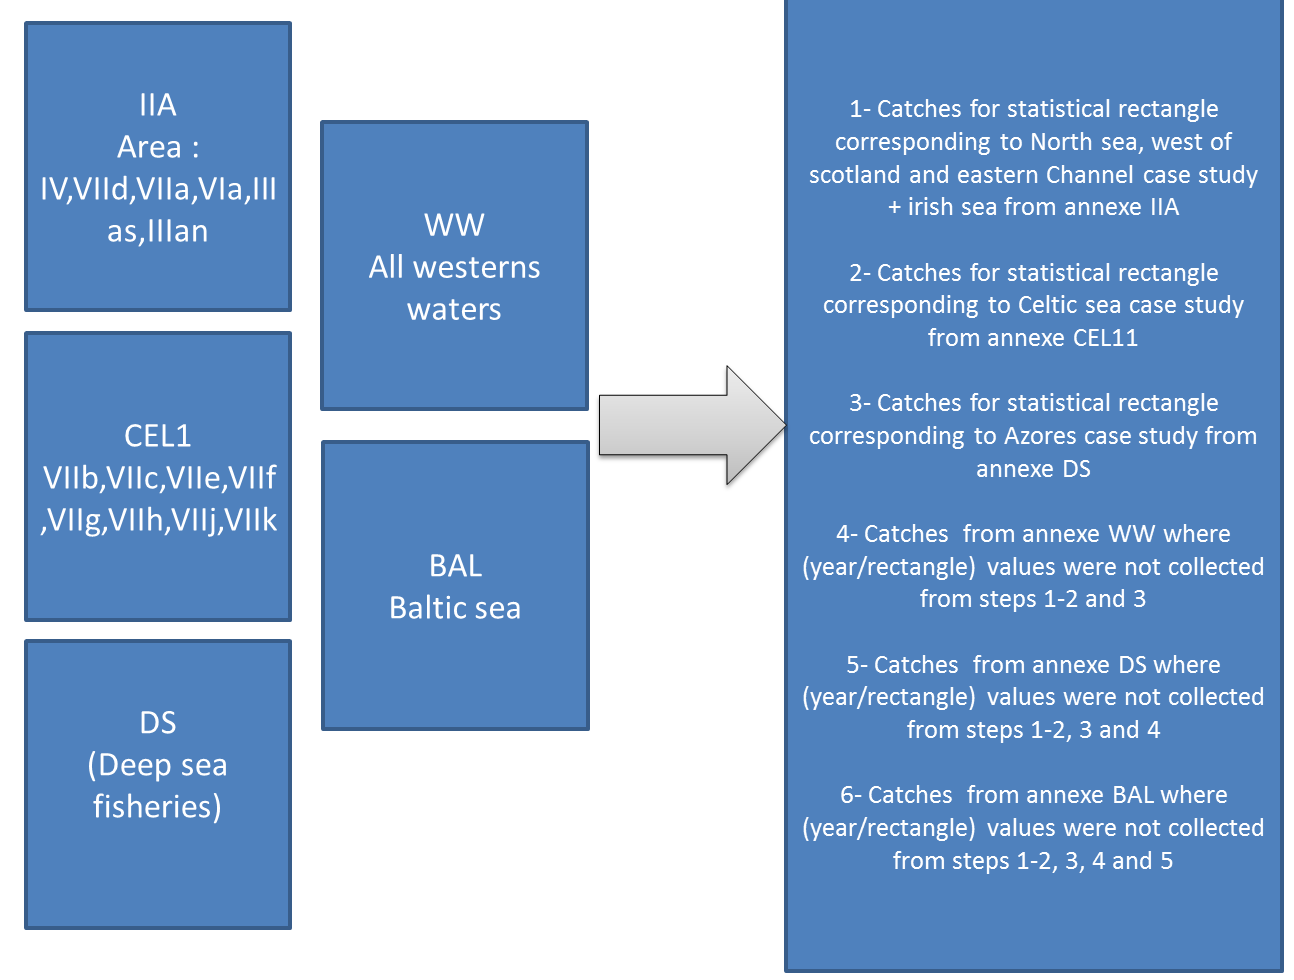
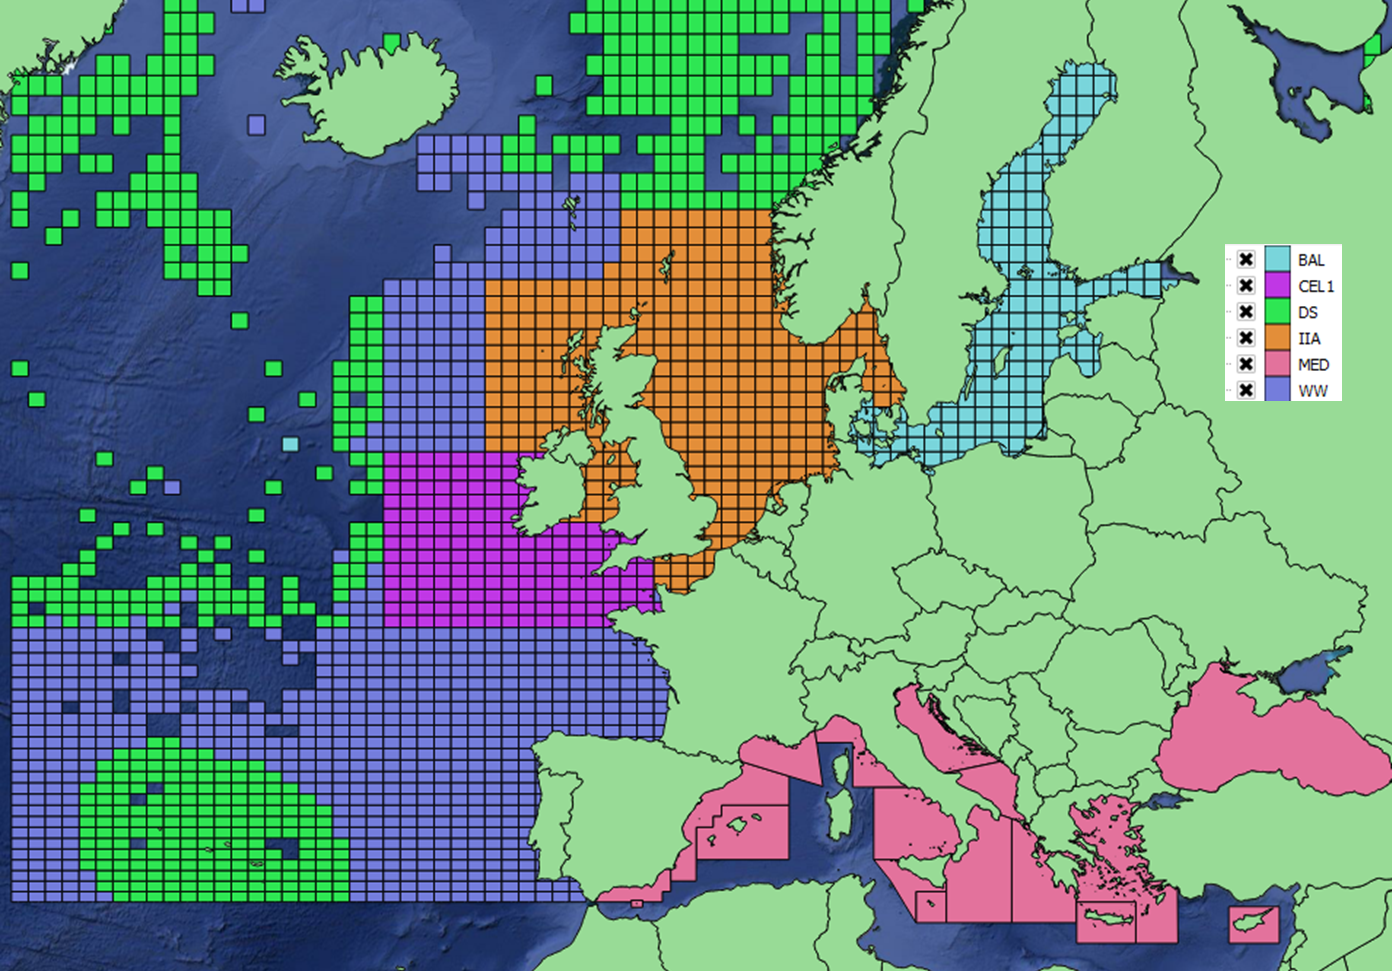
Stecf data are provided by separate effort regime (Annexe), while in this atlas a unique global database is needed to enable a global view of discards.
So the data per annex have to be merged and duplicate values must be removed. Here a choice is made to use landings and effort for each statistical rectangle from one and only one annexe
(to be validated by STECF expert) The SQL script create the landing_rect_sd (table without duplicate values)
collecting first values for case studies North Sea, Celtic Sea, Azores and Baltic sea and then adding values from WW (Western Waters) and DS (Deep Sea) annexes where year/rectangle values are not yet available
We also have the discards ratio by Annexe, and sub area. For each Case study we will take into account the annexe/subarea available from catches values (in landing_rect_sd).
And we will link the catches of a rectangle to the discard ratio of the corresponding Annexe/subarea
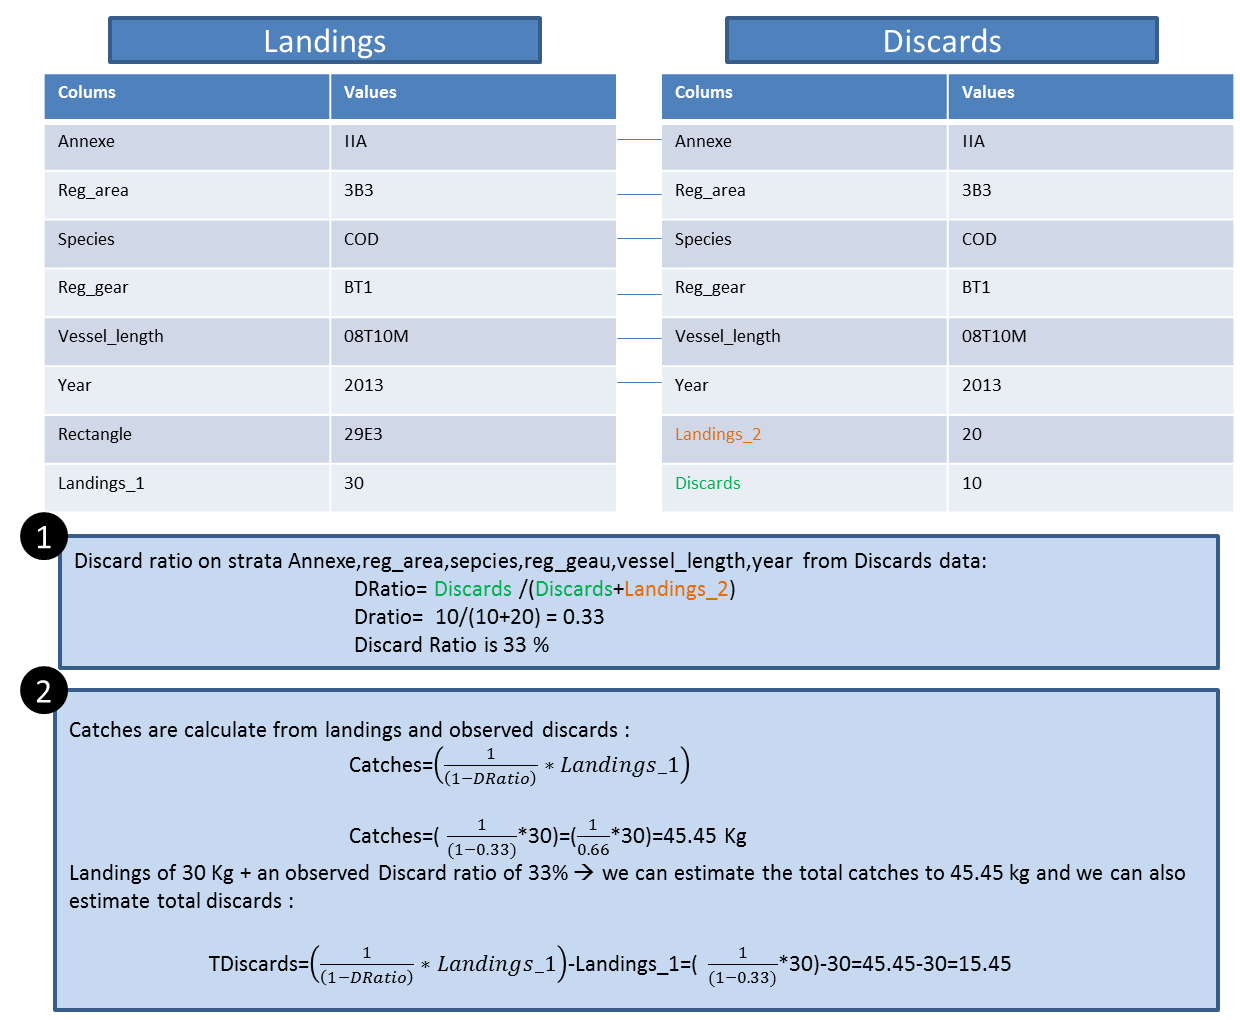
Data combination
Once the database is filled-up, we can use landings and discard ratio to estimate Catches and total Discards.
Here is a schema and a sample of calculation made to produce indicators.
How to use the indicators
Several options are provided with each indicator :
 Enlarge the graph : when, because of screen size, some details are not displayed on graphs you can open a new window
specific for the chosen indicator. So then you can decide yourself of the indicator size
Enlarge the graph : when, because of screen size, some details are not displayed on graphs you can open a new window
specific for the chosen indicator. So then you can decide yourself of the indicator size
 Clicking on this icon will open the interactive map and add the layer. You can add more than one layer if needed. If you want to close the interactive map, just click on the
 icon
icon
 Delete the layer from the Interactive map
 View and Download data used to produce the graph
 Extract tha same indicator for a list of factsheet. Produce comparable view of the information.
 Short Reading guide.
 Meta data / Indicator description : from the objectives of the indicator to the precise sql query used to produce the data.
You can also access a description of the process used to produce the data.
Meta data / Indicator description : from the objectives of the indicator to the precise sql query used to produce the data.
You can also access a description of the process used to produce the data.