

Maps of unwanted catches / Eastern Channel
A tool to describe landings and discards in a mixed fishery’s context – France, English Channel.
General description of the tool
From a Landing Obligation perspective, if a species is potentially seen as choke species, then
fishermen may try to avoid it by redistributing their effort along the year and across their fishing
areas. Lots of maps have consequently been produced to spatialize landings based on the coupling
of logBooks and VMS. These maps are either based on monospecific landings or based on
clustering of species composition of the landings. When mapping landings of a species in volume
or average proportion in landings, it is not possible to determine if areas with high landings (or
high proportions) result of numerous fishing operations with the species as by-catch or of few
targeted operations. These two situations have very different implications in terms of avoidance
ability.
We instead propose a tool that maps the risk of catching a given species in a given area at the fleet
and gear (métier) scale.
Input data
Logbooks were merged with VMS data to allow the aggregating of landing at any spatial scale
(.25’*.25’ in the following document). All landings by species were then expressed as a fraction of
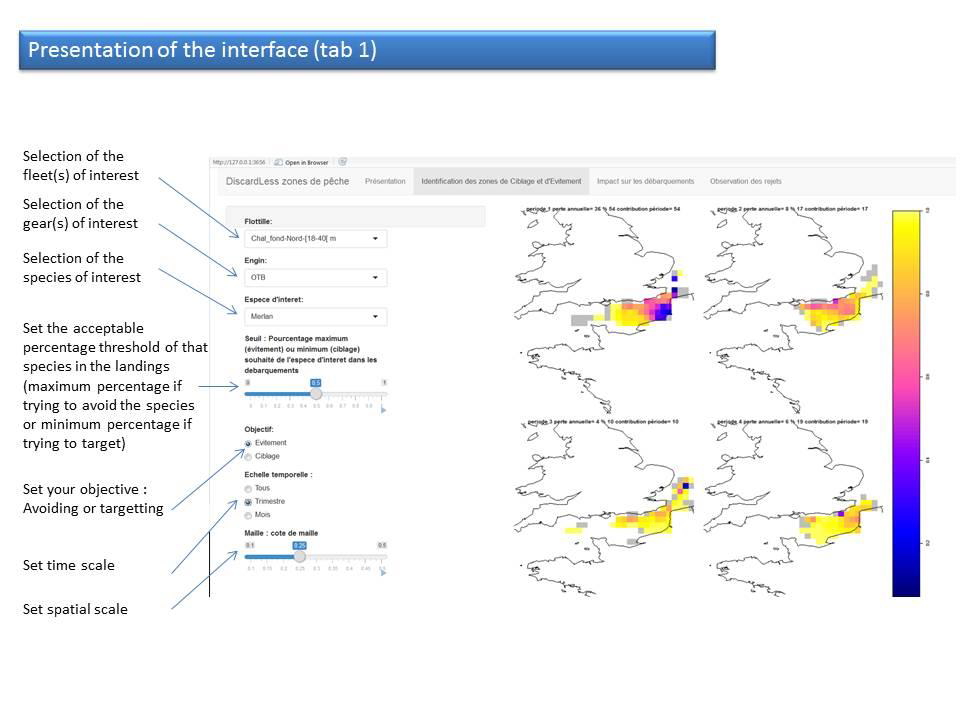
the total landings reported for a fishing operation (as estimated by the VMS reallocation). The user
then defines a maximum proportion (resp. minimum) of the species in the landings (proportion
threshold), that he is willing to accept depending on the objective i.e. avoiding or targeting the
species. Indeed the acceptable proportion may depend on the species and situation: e.g. TAC
already reached (then the proportion must be null), de minimis (a threshold is imposed by the
regulation), or optimization of quota over the year (avoiding is not compulsory but may allow
spreading activity over the year). The probability of avoiding (resp. targeting) the species is then
mapped as the proportion of the fishing operations that meets the objective at the cell scale. The
time scale is user-defined (either year/quarter or month).
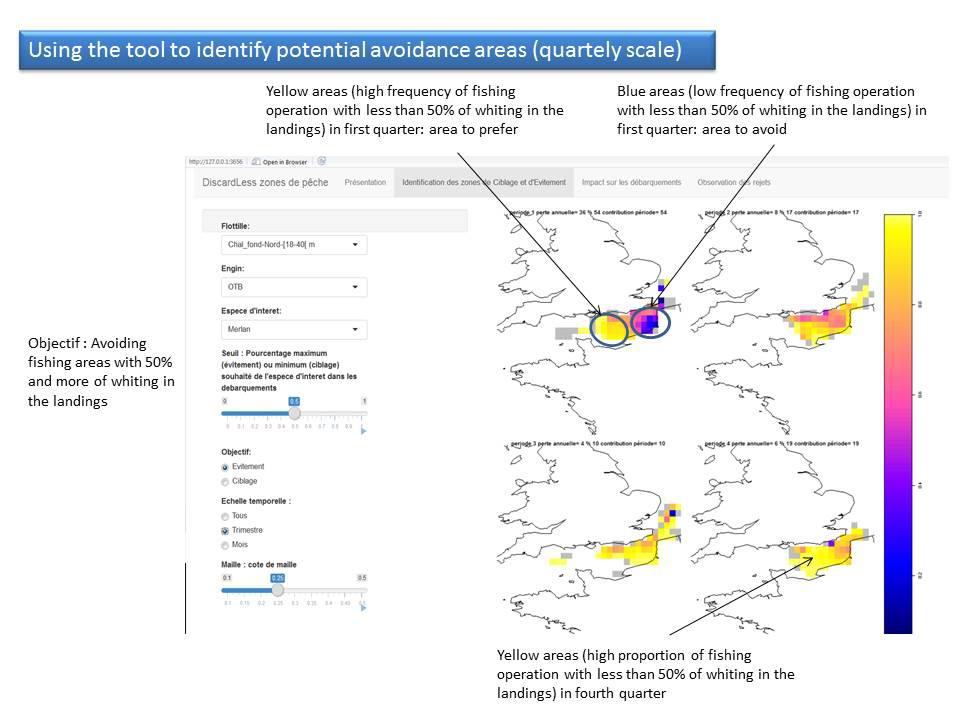
By playing with the proportion threshold and the risk level, fishermen can visualize areas to avoid
and target. For instance they may choose to avoid a species by fishing in areas with high frequency
of low proportions. Alternatively they may take the risk to go fishing in areas where that species
was seen in the landings in high proportion but only occasionally. They can choose this strategy
34This project has received funding from the European Union’s Horizon 2020 research and innovation programme
under grant agreement No 633680 in a case where some technical avoidance can be put in place or they can endorse that risk in term
of quota: proportion threshold high but frequency low. It also provides guidance for a
reorganization of the activity within the year by allowing comparison of risk maps between
seasons and months.
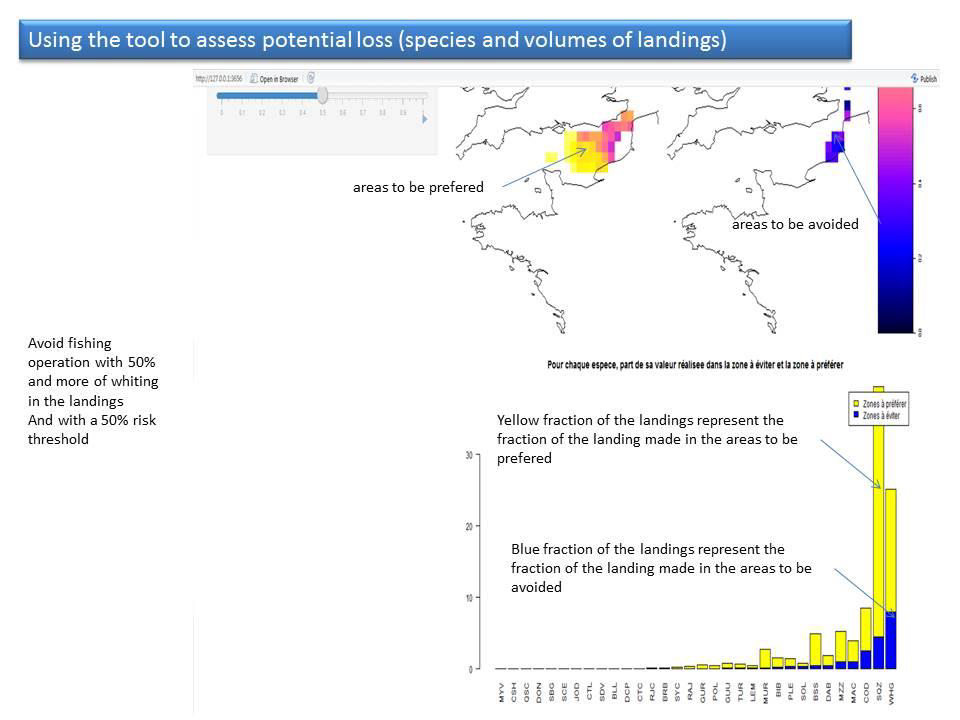
However, when restricting an area, fishermen will be interested in the proportion of the landings
and revenues lost for the species of interest and the other species caught jointly. That is the
purpose of the second tab of this tool. The user can then choose the acceptable level of risk he is
willing to accept and directly see what are the areas overshooting this risk or those lower than the
predefined risk. The tool will then map separately areas to be avoided and areas to be preferred.
Associated to this cartographical representation of the landings, a graphic representing the
percentage of the landed value of each species historically realized in each of the two areas (to be
avoided or preferred) is provided.
The tool takes the form of a web interface with three tabs for mapping risk, quantifying losses and
gains and mapping discards. It was built on declarative data over the period 2008-2014 and
implemented within the R framework (library shiny).A minimum of nine operations per cell was
set, below which the data is considered not representative and the cell colored in grey (with
opposition with white that means no data).
Discussion
A limit of the tool pertains to the nature of data used that is to say landings instead of catches.
Indeed, a low proportion of a species in landings does not guaranty a low proportion in the catch
if discarding occurred. Data available in the onboard observer program were too scarce too allow
a level of details appropriate for operational use (métier and spatial scale). However information
regarding discards is made available in a third tab to allow relativizing the information in landings.
The principle of representation is similar as for landings with cell color representing the
frequency of observation of operations with a certain rate of discard of the species.
The tool has the advantage of preventing implementing new constraints to fishing activity thus
leaving fisher with their freedom of choice while providing them with a decision support tool.
The tool was presented to fishermen representatives during a DiscardLess meeting held in
Boulogne sur Mer in January 2018. Despite the complexity of the tool, the representatives rapidly
understood the concept and recognized its practical interest. Two uses of it were envisioned: first,
as originally planned, as a tool to help avoiding discards and second as a support in negotiations
regarding the maximum allowed proportion of species in landings. Indeed, the tool evidenced that
no cell present a high probability of having less than 1% of sea bass in the landings (the proportion
currently under discussion) while respecting a 5% limit implies avoiding a third of the Eastern
Channel, a measure much more realistic and acceptable for the fleets.
Several improvements were proposed and are in course of implementation: First an estimation of
the expected revenues when avoiding a zone and reporting effort in the left opened area, second
a graph of the proportion of the Channel that needs to be avoided as a function of proportion
threshold and acceptable risk. Finally they would like to be able to select the years that enter the
computation because some years were known to display unusual conditions. Representative
requested that the tool be presented at the next national fishing commission.
Outputs
The following graphics show how the tool can be used, and some of the data outputs provided.
References
Citation :
Fiche Maps of unwanted catches / Eastern Channel, Author(s) : Youen Vermard, Sigrid Lehuta, Ifremer
DiscardLess (2018) : Tools to help strategy modification to decrease discards amount.