

Hotspot map explorer / Celtic Sea
Hotspot mapping in the Celtic Sea to best inform fishing practices under the Landing Obligation
General description of the tool
FAdvanced spatial analysis techniques and methods used to identify and manage the spatio-
temporal nature of bycatch are acknowledged as being important in optimising catch composition
and extending fishing opportunitis under the Landing Obligation (LO) (Dunn et al., 2011;
Paradinas et al., 2016, Vignaux, 1996; Tidd et al., 2012; Van Putten et al., 2012; Vilela and Bellido,
2015). Survey data collected from research vessels, observer data collected from commercial
fishing vessels and catch information from logbooks, coupled with VMS data can be used to
produce maps that identify species hotspots. The inclusion of discards in such data sources
provides more precise estimates of catch than just using landings data alone (Viana et al., 2013).
Maps produced from observer data could, therefore, provide a real insight into the spatial
distribution of all species caught by commercial vessels. There are, however, problems associated
with discard sampling from observers including low sampling frequency and irregular sampling
(Villasante et al., 2016).
Input data
Data
Data collected by onboard observers working on Irish, British and French vessels operating in the
Celtic Sea between 2010 and 2015 were used in the analyses. Data were collected by each member
state as part of the EU data collection framework (Council regulation (EC) No 199/2008).
Observer data were specifically used as it is the only source of information on the component of
catches that are discarded at sea providing biological data on the whole catch and not just fish and
shellfish later landed. In addition meta-data such as the position and duration of hauls, gear and
mesh size used, vessel type and vessel size are all collected by observers. Initial analysis
concentrated on data collected on-board TR1 vessels i.e. those operating bottom trawls, Danish
seine nets and similar towed gear with mesh sizes between 70mm and 100mm, but excluding
beam trawls (Davie and Lordan, 2011).
Mapping Methodology
The geographical midpoint of all hauls were calculated and catch data assigned to this point. Catch
data were then assigned to 0.2 by 0.2 degree grid cells to ensure individual vessel and national
data could not be identified. The proportion of the haul by weight for both the below and above
MCRS (minimum conservation reference size) component of the catch for each species subject to
a TAC was calculated. Mean annual values were calculated for each grid cell and grid cells were
subsequently binned into 20% intervals with an additional category being used to identify where
grid cells contained zero catch within a year. A final, amalgamated map for 2010 through to 2015
was created for each species and size component grouping by identifying grid cells that were
consistently and uniquely within the same binned category over multiple years (Fig. 1).
The above process was also conducted using catch per unit effort (CPUE) rather than proportion
by weight. CPUE was calculated by dividing the total weight of both below and above MCRS TAC
species caught in each haul by the total haul duration. Again mean annual values were calculated
for each grid cell and subsequent values were divided into five equal quantiles, following the
removal of zero catches. Again an amalgamated map was created for the whole time period
studied by identifying grid cells that were consistently and uniquely within the same quantiles
over multiple years.
In addition to determining annual catch patterns, seasonal patterns were investigated by sub
setting the observer data into four data sets based on the quarter of the year in which fishing
operations took place. Mean quarterly values per grid cell for each individual year were calculated
before again being binned or assigned to quantiles with amalgamated quarterly maps being
produced for both proportion and CPUE data as before.

Figure 1. Diagram showing the steps in the map production process. (A. Individual binned maps
created for each year; B. Amalgamated map for all years identifying grid cells within consistent
binned categories over multiple years; C. Final interpolated map)
Interpolation
The resultant gridded maps show where over time consistent proportions or volumes of certain
species within the catch are likely to be found. This provides valuable information to inform where
to target fishing activities and optimise catches in relation to available quotas. To provide a more
user friendly end product the grided maps were interpolated using inverse distance weighting
using gstat in R (Pebesma, 2004; R Core Team, 2012). Due to the grid structure of the data a
number of suitable interpolation techniques were compared prior to the final interpolation
technique being applied. Proximity polygons, nearest neighbour analysis and inverse distance
weighting techniques were validated against a test data set and the root mean square error
(RMSE) was calculated for each method (Luo et al., 2008). The inverse distance weighting
interpolation consistently produced the lowest RMSE values for each interpolated map and thus
this method was used throughout our analyses.
Discussion
Hotspot mapping provides essential information to allow the optimisation of fishing efforts to
catch target species and avoid unwanted and quota restricted species. Observer data, collected
from commercial fishing vessels, provides an ideal basis for such maps as these data include the
discarded component of catches, in addition to landings. The sparse coverage of observer data and
limited sampling of commercial vessels can present problems when trying to identify patterns in
such data. By combining data from three EU member states with commercial vessels operating
within the Celtic Sea for the first time, we were able to produce maps highlighting where catches
of TAC species show consistent patterns over multiple years. Further by using the output of these
maps in an interactive app we have produced a tool that can easily be used by stakeholders to help
inform decisions on where to fish to reduce unwanted catches.
Two catch metrics were used to identify where similar catches are expected to occur over time.
CPUE gives an indication of how the volume of a species in a catch varies. When trying to avoid
non-target species it would make sense to avoid areas where there is increased probability of high
CPUE catches. When targeting species, although stakeholders are likely to be drawn to areas with
high CPUE, it is also important to consider the proportion of that species within the catch and how
clean the catch is if bycatch is to be avoided. Thus it is important to use these two metrics together,
depending on what is driving fishing behaviour and how restrictive other quotas may be in
relation to the target. Our example comparing CPUE and proportion maps for above MCRS
haddock shows how these two metrics compare and contrast. There is some agreement between
the two maps as to where hotspots of this species occur, and identifying these areas would be
beneficial to best target fishing. There is certainly less relief in the maps based on proportion by
weight and this is especially true of the below MCRS component of the catch where often there is
never greater than 20% of the catch by weight. For these cases the CPUE map provides more
detailed information as data categories are based on quantiles rather than pre-defined equal
intervals.
Under the LO all catch of TAC species regardless of size will count against quotas (European
Commission, 2013). Thus it is important to avoid all below MCRS fish as this component of the
catch cannot be sold for human consumption and receive full market value. Whilst the extent over
which below MCRS catches are likely to occur may overlap with that of the above MCRS
component of the same species we have shown that for whiting areas can be identified where it
would be possible to target large, marketable fish whilst reducing the chances of catching smaller
fish. In the Celtic Sea, where there is a mixed demersal fishery and numerous species co-occur it
is also to be able to highlight those areas where fish are less likely to occur together to allow
fishermen to target certain species whilst avoiding chokes. Haddock and whiting are two species
that co-occur but for which there are often uneven quotas (Calderwood et al., 2016) and so it may
be necessary to target one species whilst attempting to avoid the other. Again the comparison of
maps for these two species showed that there is potential to concentrate fishing efforts in areas
to minimise the likelihood of catching one whilst maximising the likelihood of catching the other.
The mapping method adopted identifies areas with consistent proportions or volumes in the catch
over time. Obviously fish populations are mobile and aren’t always going to be found in the same
location. These maps do, however, give an indication of where the likelihood of catching certain
species is greatest. Examining how cod distributions vary with season shows how important it is
for stakeholders to consider the data provided in these maps at greater temporal resolution than
just annually. Due to the resolution of input data used in this work, quarterly data is currently the
finest temporal resolution that the maps can be divided into. This still provides greater detail than
solely presenting annual data and allows fishermen to consider how the dynamics of fish stocks
over the course of a year requires seasonal adaptation to fishing practices.
It is clear that these maps hotspot provide information that is essential if stakeholders are to make
the most informed decisions when choosing where to fish whilst operating under the LO. A suite
of measures from gear adaptations through to the provision of spatial-temporal information will
be required for the fishing industry to successfully reduce unwanted catches and meet the
legislative requirements of the LO. The data provided in these maps provides one element of this
suite but to ensure this data is easily accessible and digestible it needs to be presented to industry
in the appropriate format. As a result an interactive app was developed to allow stakeholders to
pick and choose the information that is relevant to them at any one point in time. They are able to
select those species they want to target as well as those they wish to avoid and display all of the
relevant information on one map. Areas with a high chance of catching solely the target species
can easily be identified and help stakeholders to make the most informed decisions when deciding
when, where and how to fish to avoid unwanted catches. Making the information stored within
these hotspot maps easily accessible could aid in making fishing operations in the Celtic Sea more
efficient, ultimately reducing operating costs. By arming industry with such knowledge and
information it is hoped fishing operations can be optimised with fisheries continuing to be
profitable whilst operating under the LO.
Outputs
To produce a user friendly and interactive tool for use by stakeholders an app was developed
using Shiny and Leaflet in R (Chang et al., 2017; Cheng et al., 2017). Layers were extracted from
the interpolated maps based on the original bin and quantile categories. These were converted to
spatially referenced shape files and saved separately. Users of the app are able to select the time
period they are interested in (Annual Data, Quarter 1, Quarter 2, Quarter 3 or Quarter 4), the
numerous species they wish to target and those they wish to avoid. For each species selected the
user can specify whether they are interested in the below or above MCRS component of the catch.
They are then able to toggle the levels of catch they either wish to target or avoid, selecting either
the minimum proportion of the selected species or minimum level of CPUE of interest (Fig. 2).
Multiple target and non-target species can be selected at once and semi-transparent map layers
are displayed on an interactive map, identifying where selected levels of catch are likely to occur.
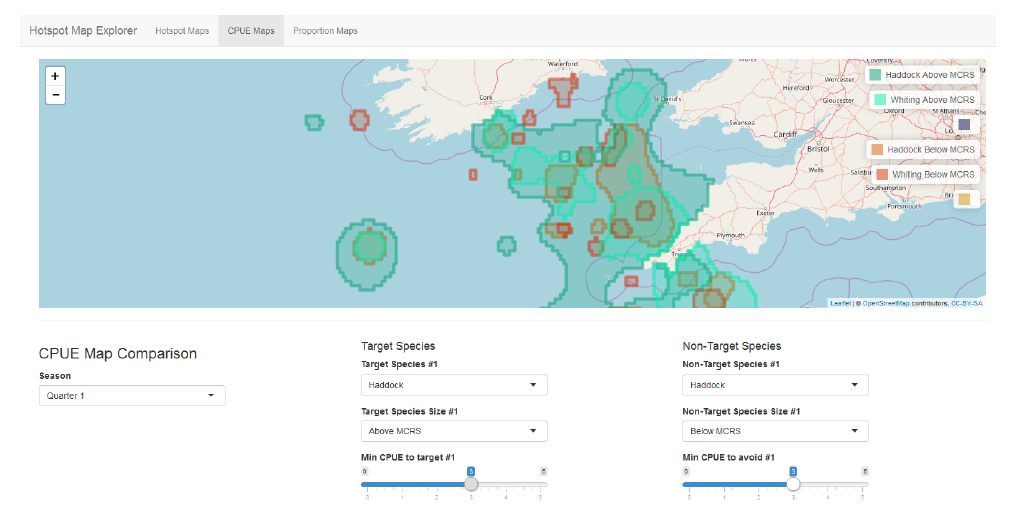 Figure 2. A screenshot of the shiny app developed to allow stakeholders to select the size, species
and quantity of fish they would like to target and/or avoid during different seasons. The resultant
map displays layers representing where to target or avoid fishing operations to optimise catch
composition.
Figure 2. A screenshot of the shiny app developed to allow stakeholders to select the size, species
and quantity of fish they would like to target and/or avoid during different seasons. The resultant
map displays layers representing where to target or avoid fishing operations to optimise catch
composition.
Results
The maps as described previously have been created for the above and below MCRS component
of the catch for all demersal species subject to a TAC. To better focus comparison and analysis of
the results this paper will focus on three key species; haddock, whiting and cod. Both haddock and
whiting have been recognised as high risk species in the Celtic Sea with catches exceeding TAC
across multiple member states (Rihan et al., 2017). Cod has also been noted as being at moderate
risk for member states as a whole but presents particular problems for the Irish fleet due to low
quota share amongst its’ vessels (Calderwood et al., 2016). Examples of how the information in
these maps compares and contrasts for selected species are described below.
CPUE vs Proportion
Both CPUE (kg hr -1 ) and proportion by weight in the catch were used as metrics to identify
hotspots of key TAC species. Figure 3 shows an example of how these two metrics compare for
above MCRS haddock in the Celtic Sea. Areas with consistently high levels of haddock CPUE within
the catch are centred around the coordinates 51.1 -6.85 between the south coast of Ireland and
the north coast of Cornwall and to the west of Ireland centred around the coordinates 52.5 -11.0
(Fig 3.A). Catches where above MCRS haddock consistently constitutes at least 20% of the catch
are identified in similar locations (Fig3.B), although for both areas higher proportions of haddock
are identified closer in towards the coast than with the CPUE data. There are also a few
discrepancies with small hotspots of high CPUE areas at 51.4 -9.4, 51.4 -11.2 and 50.3 -10.5 not
being reflected in the proportion data. Similarly areas with high proportions of haddock identified
at 51.79 -10.49 and 51.13 -7.14 are not reflected in the CPUE data. Less relief is also evident on
the map representing the proportion of haddock in the map as few catches were identified with
greater than 60% of haddock in the catch.
 Figure 3. Interpolated maps identifying A. Areas with consistent levels of >MCRS haddock CPUE
over multiple years (2010-2015) and B. Areas with consistent proportion of >MCRS haddock in
the catch by weight over multiple years (2010-2015).
Figure 3. Interpolated maps identifying A. Areas with consistent levels of >MCRS haddock CPUE
over multiple years (2010-2015) and B. Areas with consistent proportion of >MCRS haddock in
the catch by weight over multiple years (2010-2015).
Below MCRS vs Above MCRS catches
All species maps were created for two size categories based on fish either below or above MCRS,
allowing for a comparison of the distribution of these two size categories amongst and between
species. When comparing whiting catches the largest volumes are again caught in an area centred
around the coordinates 51.1 -6.85 (Fig. 4). The majority of points with the greatest CPUE of below
MCRS whiting are also encompassed by the areas with greatest CPUE for above MCRS whiting.
Areas with high CPUE of below MCRS whiting do, however, cover a much smaller area compared
to the above MCRS component of the catch. Small distinct hotspots, representing the highest CPUE
category, cover a total area of less than 430km 2 for below MCRS catches compared to 9500km 2
for the above MCRS catches in the same CPUE category. There are also a few distinct patches
identified as having a high likelihood of high above MCRS catches where there are no below MCRS
catches identified. Namely along the 52.5 degree latitude line and just off of the south west coast
of Ireland at approximately 51.3 -9.28.
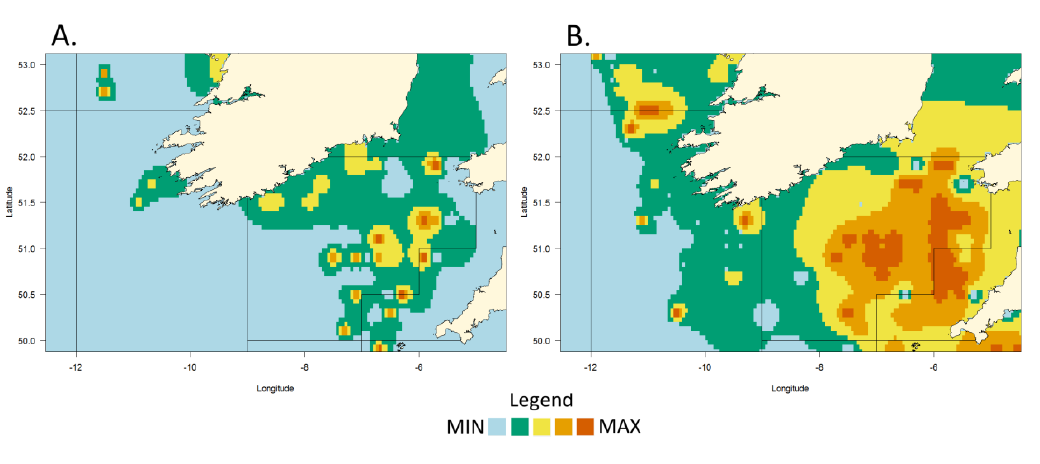 Figure 4. Interpolated maps identifying areas with consistent levels of whiting CPUE over multiple
years (2010-2015) for A. Below MCRS fish and B. Above MCRS fish
Figure 4. Interpolated maps identifying areas with consistent levels of whiting CPUE over multiple
years (2010-2015) for A. Below MCRS fish and B. Above MCRS fish
Species Comparison
The same metric can be used to compare the likelihood of different species co-occuring. The area
with consistent proportions of haddock in the catch over multiple years in the Celtic Sea for
example is much greater than that of whiting (Fig.5). No areas are identified as having consistent
proportions of whiting in the catch south of the 52.5 degree latitude line or west of the -9 degree
longitude line (Fig.5B). There is a distinct chance of catching haddock in this area, with some
hotspots of up to 60% of haddock being identified (Fig.5A). There is also overlap of the haddock
and whiting map extents, especially within area VIIg. Overall there are relatively small areas being
noted as consistently having at least 20% of whiting in the catch, whilst areas identified as likely
to have at least 20% of above MCRS haddock in the catch cover a much greater extent
(approximately 5200km 2 compared to 38700km 2 ).
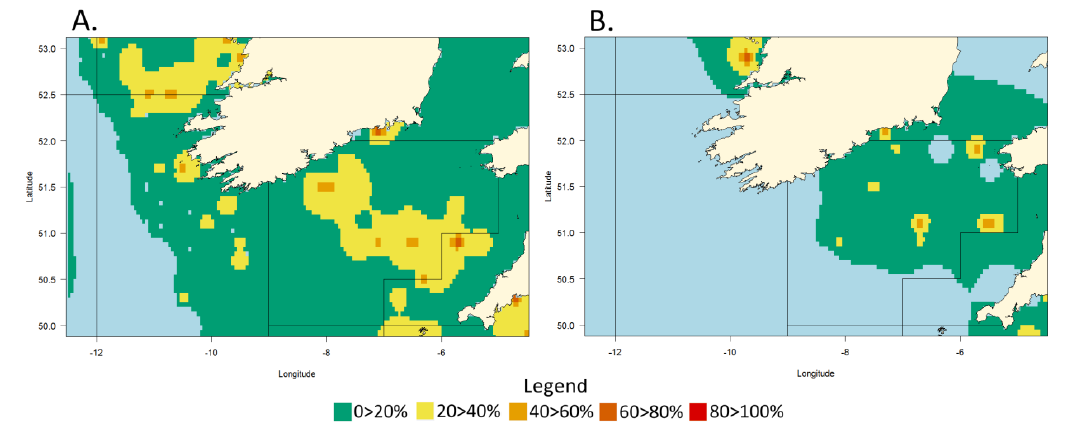 Figure 5. Interpolated maps identifying areas with consistent levels of the proportion of above
MCRS A. Haddock and B. Whiting in the catch over multiple years (2010-2015)
Figure 5. Interpolated maps identifying areas with consistent levels of the proportion of above
MCRS A. Haddock and B. Whiting in the catch over multiple years (2010-2015)
Seasonal variation
Seasonal variation in catches can be identified by examining amalgamated quarterly rather than
annual data. When comparing areas where there are likely to be consistent levels of CPUE of above
MCRS cod over each quarter distinct seasonal patterns can be seen (Fig.6). In the first quarter of
the year areas with consistent levels of cod in the catch are found in a small number of isolated
spots within area VIIg. Moving on to quarter two there is a sudden large expansion in the range of
the area where cod is likely to be caught. In this period the area covered by the map layers extends
to most of area VIIg. During the third quarter of the year the extent of the map retracts a little,
splitting into two smaller regions within VIIg and also extending further east into VIIf, with some
hotspots being concentrated along the boundary between these two ICES areas. In the final
quarter of the year the extent of the cod CPUE map retracts further shifting north towards the
south coast of Ireland in addition to a small hotspot emerging just above the north coast of
Cornwall in areas VIIf.
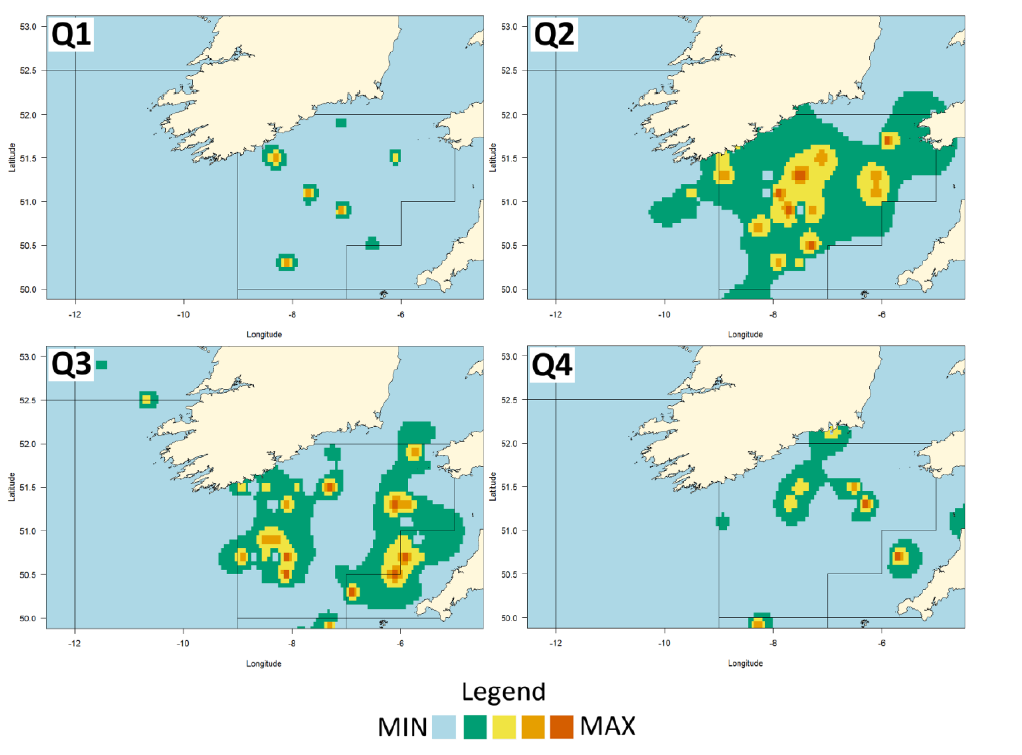 Figure 6. Interpolated maps identifying areas with consistent levels of CPUE for above MCRS cod
over multiple years (2010-2015) for each quarter of the year.
Figure 6. Interpolated maps identifying areas with consistent levels of CPUE for above MCRS cod
over multiple years (2010-2015) for each quarter of the year.
Shiny App
All of the maps produced provide useful information that can be compared in numerous ways
depending on the user’s interests and objectives. Providing the maps in an interactive app thus
provides the opportunity to pick those layers of interest to easily compare and contrast. Figure 2,
for example, shows the overlap of four different layers. The first two are species that wish to be
targeted. Both above MCRS haddock and whiting have been selected as the target species, with
the level of CPUE being set to include the highest two levels identified during the mapping
analysis. Below MCRS haddock and whiting are selected as the non-target species, again with the
layers highlighting the two highest levels of CPUE identified. The resultant overlap of all of these
layers is displayed within an interactive map layer. Although there are overlaps between all four
of the layers there are distinct areas that highlight where just the target species are likely to be
found.
References
Calderwood, J., Cosgrove, R., Moore, S.-J., Hehir, I., Curtin, R., Reid, D., and Graham, N. 2016.
Assessment of the impacts of the Landing Obligation on Irish Vessels.
http://www.bim.ie/media/bim/content/publications/Lo,report,2016_final.pdf.
Chang, W., Cheng, J., Allaire, J., Xie, Y., and McPherson, J. 2017. shiny: Web Application Framework
for R. https://cran.r-project.org/package=shiny.
Cheng, J., Karambelkar, B., and Xie, Y. 2017. leaflet: Create Interactive Web Maps with the
JavaScript ‘Leaflet’ Library. https://cran.r-project.org/package=leaflet.
Davie, S., and Lordan, C. 2011. Examining changes in Irish fishing practices in response to the cod
long-term plan. ICES Journal of Marine Science, 68: 1638–1646.
Dunn, D. C., Boustany, A. M., and Halpin, P. N. 2011. Spatio-temporal management of fisheries to
reduce by-catch and increase fishing selectivity. Fish and Fisheries, 12: 110–119.
European Commission. 2013. Proposal for a Regulation of the European Parliament and of the
Council amending Council Regulations (EC) No 850/98, (EC) No 2187/2005 (EC) No
1967/2006, (EC) No 1098/2007, No 254/2002, (EC) No 2347/2002 and Landing, (EC) No
1224/2009 and repealing (EC) N.
Luo, W., Taylor, M. C., and Parker, S. R. 2008. A comparison of spatial interpolation methods to
estimate continuous wind speed surfaces using irregularly distributed data from England
and Wales. International Journal of Climatology.
Paradinas, I., Marin, M., Pennino, M. G., López-Quílez, A., Conesa, D., Barreda, D., Gonzalez, M., et al.
2016. Identifying the best fishing-suitable areas under the new European discard ban.
ICES Journal of Marine Science, 73: 2479–2487.
Pebesma, E. J. 2004. Multivariable geostatistics in S: the gstat package. Computers and
Geosciences, 30: 683–691.
R Core Team. 2012. R: A language and environment for statistical computing. R Foundation for
Statistical Computing, Vienna, Austria.
Rihan, D., Graham, N., and Vandamme, S. 2017. North Western Waters Choke Species Analysis.
NWW Member States & NWW Advisory Council. http://www.nwwac.org/_fileupload/Minutes and Reports/2017/MSG-AC choke
analysis/NWW choke analysis_Executive Summary.pdf.
Tidd, A. N., Hutton, T., Kell, L. T., and Blanchard, J. L. 2012. Dynamic prediction of effort reallocation
in mixed fisheries. Fisheries Research, 125–126: 243–253. Elsevier B.V.
http://dx.doi.org/10.1016/j.fishres.2012.03.004.
Van Putten, I. E., Kulmala, S., Thébaud, O., Dowling, N., Hamon, K. G., Hutton, T., and Pascoe, S. 2012.
Theories and behavioural drivers underlying fleet dynamics models. Fish and Fisheries.
Viana, M., Jackson, A. L., Graham, N., and Parnell, A. C. 2013. Disentangling spatio-temporal
processes in a hierarchical system: A case study in fisheries discards. Ecography.
Vignaux, M. 1996. Analysis of vessel movements and strategies using commercial catch and effort
data from the New Zealand hoki fishery. Canadian Journal of Fisheries and Aquatic
Sciences, 53: 2126–2136.
Vilela, R., and Bellido, J. M. 2015. Fishing suitability maps: helping fishermen reduce discards.
Canadian Journal of Fisheries and Aquatic Sciences, 72: 1191–1201.
Villasante, S., Pierce, G. J., Pita, C., Pazos, C., Garcia, J., Antelo, M., María, J., et al. 2016. Fishers’
perceptions about the EU discards policy and its economic impact on small-scale fisheries
in Galicia (North West Spain ). Ecological Economics, 130: 130–138. Elsevier B.V.
http://dx.doi.org/10.1016/j.ecolecon.2016.05.008.
Citation :
Fiche Hotspot map explorer / Celtic Sea, Author(s) : Julia Calderwood & Dave Reid – MI, Youen Vermard, Mariane Robert & Lionel
Pawlowski – IFREMER, and Tom Catchpole & Zachary Radford - CEFAS
DiscardLess (2018) : Tools to help strategy modification to decrease discards amount.