

Maps of discards based on survey and onboard observers / Balearic Islands
Identification of locations, times and practices to fish to avoid unwanted catch - Balearic Islands
General description of the tool
According to Article 15 of the Common Fisheries Policy (Regulation EU No 1380/2013), the
Landing Obligation in the Mediterranean applies to catches of species which are subject to
minimum sizes as defined in Annex III of Regulation (EC) No 1967/2006 (Table 1).
The Mediterranean demersal fisheries are both multifleet and multispecific, with more than 100
species in their landings (Moranta et al. 2008). In addition, both small-scale and bottom trawl
fisheries are characterized by spatial and temporal variability of their fishing strategies that
mainly depend on the bathymetric range and determine both the target species and demersal
communities exploited (Colloca et al. 2003, Massuti and Renones 2005).
In the Balearic Islands (western Mediterranean), commercial trawlers use up to four different
fishing tactics (Palmer et al. 2009), which are associated with the shallow and deep continental
shelf, and the upper and middle continental slope (Guijarro and Massuti 2006, Ordines et al.
2006). Vessels mainly target striped red mullet (Mullus surmuletus) and European hake
(Merluccius merluccius) on the shallow and deep shelf respectively. However, these two target
species are caught along with a large variety of fish and cephalopod species. The Norway lobster
(Nephrops norvegicus) and the red shrimp (Aristeus antennatus) are the main target species on the
upper and middle slope respectively. The Norway lobster is caught at the same time as a large
number of other fish and crustacean species, but the red shrimp fishery is the only Mediterranean
bottom trawl fishery that could be considered monospecific.
Stakeholders from the Balearic Islands consider that the best measures to reduce discards in the
Mediterranean fisheries are the improvement of gear selectivity and the use of spatiotemporal
closures for effort control (Task 2.5). They also consider that in order to protect recruitment, both
the fishermen skill and the available scientific knowledge can allow identifying the best seasons,
depths and/or areas to be closed for some target species of the bottom trawl fishery. Such
considerations are in line with the main aim of this task, which is to provide decision support tools
to assist fishers to make choices of fishing location to avoid discards. This work develops the
scientific information on fish distributions in time and space, nursery areas and discarding
hotspots from the Balearic Islands (Western Mediterranean Case Study) bottom trawl fishery.
Input data
Species analysed
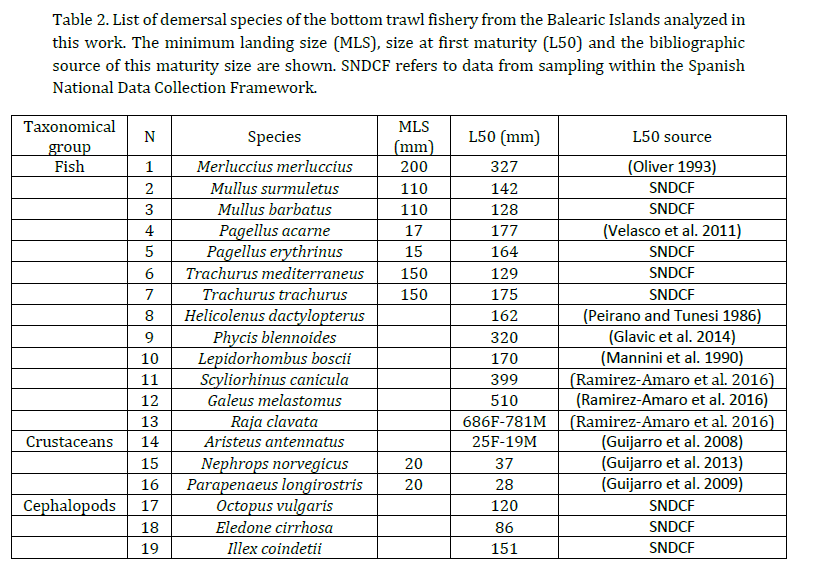
A total of 19 demersal species, including fish, crustaceans and cephalopods, were chosen for the
analyses (Table 2). Together with the species regulated by MLS in the Mediterranean, the most
important commercial species for the bottom trawl fishery from the Balearic Islands were studied.
Analyses to delineate hotspots for these species were done considering two different criteria for
the definition of recruits and adults: 1) MLS in the case of the species under regulation; and 2) size
at first maturity (L50) for those species without MLS but also for those having MLS.
Data sources and analyses
Two different data sources were used: 1) Fishery independent data taken during scientific surveys
(MEDITS); and 2) Fishery dependent data collected by observers on board bottom trawlers
working under commercial conditions. These two data sources were analysed separately due to
differences in the spatiotemporal sampling. Whereas surveys only provide information of the
specific period when they are performed, the monitoring of the fishery along the year allows
analysing seasonal changes. Whenever possible (see Results), all study species were analyzed
from samples taken by these two different sampling sources.
Fishery independent data: MEDITS surveys
A two step methodological approach following (Colloca et al. 2015) were used in order to analyze
the spatial distribution of species density (number of individuals per Km 2 ). The methodology
started with the identification of areas with higher densities (hotspots) on an annual basis, and
then analyzed the persistence of these hotspots through the time series as indicative of the most
important areas of density that are independent of interannual variability. Finally, the overlap of
persistent hotspots for the different fish species was also analyzed.
Data was collected during the MEDITS scientific trawl surveys, which are annually conducted in
spring-summer in European Mediterranean waters (Bertrand et al. 2002). The study area covered
the continental shelf and upper slope fishing grounds between 50 and 800 m depth around the
Balearic Islands (Western Mediterranean, Fig. 1). A total of 766 bottom trawls conducted between
2003 and 2016 were analyzed. Although the surveys are carried out from 2001, only data
collected between 2003 and 2016 were used in order to analyse the same time period for the two
data sources (information from onboard samplings is only available from 2003 on).
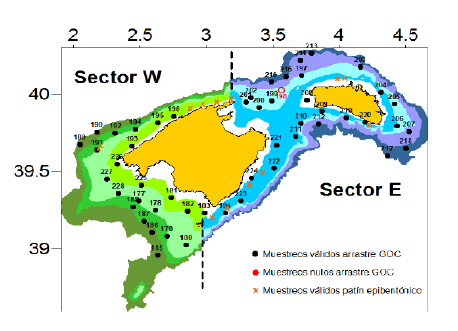 Fig. 1. Location of the sampling stations analysed annually during the MEDITS surveys carried out
around the Balearic Islands.
Fig. 1. Location of the sampling stations analysed annually during the MEDITS surveys carried out
around the Balearic Islands.
On a first step, the spatial distribution of the study species was analyzed considering, as
aforementioned, different population fractions (under and above the MLS and the L50). The
spatial modelling was performed with generalized additive models (GAMs; (Wood 2006) using
the “mgcv” R-package. The smoothing parameters were selected by restricted maximum
likelihood (REML), which is supposed to be more effective than other available options (Marra
and Wood 2011). Depth, position (longitude, latitude) and year were used as explanatory
variables in the GAMs.
Owing to the high frequency of zeros in the data, a two-stage GAM approach was used (Barry and
Welsh 2002, Borchers et al. 1997). This approach assumes independence between presence-
absence and abundance values, so that the likelihoods are obtained by multiplying the predictions
of the two components (presence-absence and abundance). In the first stage, a presence-absence
variable is constructed by giving a value of 1 to observations where the response variable is
greater than zero and a value of 0 otherwise. The derived variable is modelled as a binomial
distribution with a logit link function. In the second stage, the log-transformed abundance is
modelled by means of a Gaussian distribution with an identity link function. Finally, the
predictions of the models in both stages are multiplied at each prediction grid cell in order to
obtain an estimation of species abundances.
On a second step, the selected models were used to produce annual predictions of the spatial
distribution of the species abundances in a squared mesh grid with cells of 0.01 x 0.01
geographical degrees. Hotspots were defined on an annual basis as those grid cells in which the
predicted value of abundance (N/km 2 ) was above a threshold defined as the upper level of the
95% confidence interval of the mean predicted values in the whole time series in the “optimal”
depth range for each species and population fraction. This “optimal” was defined as the depth
range at which the output of the GAM model for the depth smoother was above 0 (i.e. above the
mean abundance when considering the depth effect). The temporal persistence of the hotspots at
a grid cell level (probability of being a hotspot) was defined as the amount of years for which a
particular cell in the spatial grid was identified as a hotspot divided by all the years in the time
series.
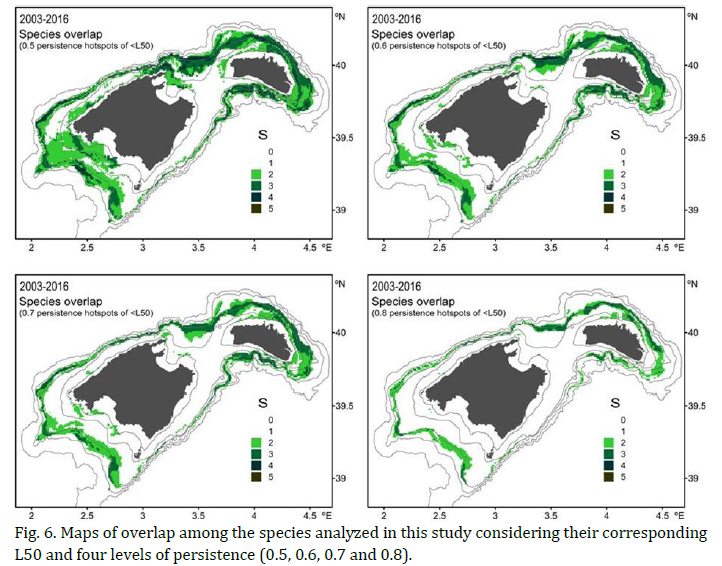
Finally, spatial overlap among persistent hotspots of the different species was also investigated.
An overlap index, obtained as the sum of species (≥2 species) that had persistent hotspots in a
particular grid cell, was calculated. In this case, the overlap was assessed considering four
different levels of persistence when defining persistent hotspots: 0.5, 0.6, 0.7 and 0.8.
Fishery dependent data: on board bottom trawlers sampling
This data source was used to provide information on the spatiotemporal distribution and
potential main discarding hotspots of the study species. The on-board observers program is
carried out within the EU Data Collection Framework (DCF) that takes place in the Balearic Islands
from 2003. The monitoring of the bottom trawl fishery consists of five monthly samplings on
board randomly selected vessels, which ensures temporal and spatial coverage of the fishing
activities.
The information collected by the observers includes the main characteristics of the haul (e.g. date,
position, duration, depth) and the weight by species of the commercial catch and discards.
Representative size-frequency distributions of the most important species of both the commercial
catch and discards are also taken. In the case of crustaceans, these size distributions are collected
for males and females separately.
The random sampling scheme used during the onboard sampling does not allow producing maps
as in the case of the regular sampling scheme performed during the MEDITS scientific surveys.
For this reason, data were analysed for the main commercial fishing grounds of the bottom trawl
fleet. VMS data around the Balearic Islands were used to define such fishing grounds (Farriols et
al. 2017). The VMS signals were assigned to a net of points defined from a 0.01 degrees resolution
grid using Matlab R2013a, and the different fishing grounds were inferred from VMS density
contours assigned at each grid point. A total of 32 fishing grounds were identified around the
Balearic Islands (Fig. 2). Finally, using expert knowledge of the bottom trawl fishery in the area,
each fishing ground was checked in order to differentiate adjacent fishing grounds and delimiting
fishing grounds with low densities of VMS.
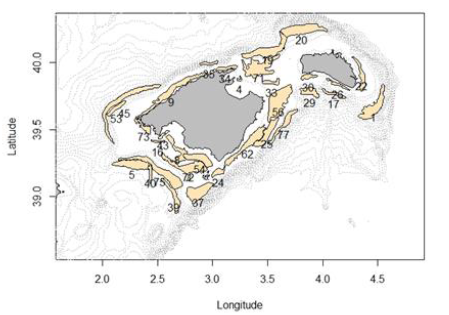 Fig. 2. Main fishing grounds used by bottom trawl fishers from the Balearic Islands.
A total of 1445 fishing hauls performed between 2003 and 2016 were analysed (Fig. 3). The mean
species density (number of individuals per hour of effective trawling) and the species size-
frequency distribution were computed for each fishing ground. As above, these two parameters
were obtained for individuals under and over the MLS and the L50. Both seasonal and interannual
variations in species density were analysed.
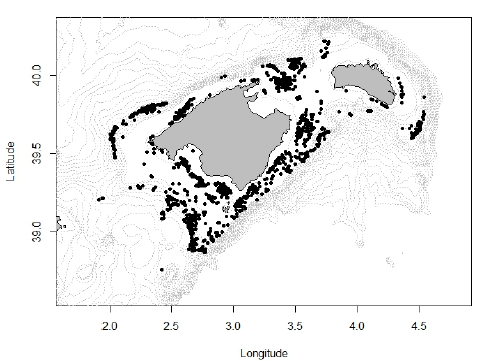 Fig. 3. Stations of the on board commercial trawlers sampling from the Balearic Islands used in
this work.
Fig. 3. Stations of the on board commercial trawlers sampling from the Balearic Islands used in
this work.
Feedback with fishers
The main objective of Task 4.3 was “using the knowledge from fisheries scientists in collaboration
with fishers to identify the best locations, times and practices to fish to avoid unwanted catch”.
Once available, the main results of this Task for the Balearic Islands study area were presented to
fishermen in order to check if these results were in accordance with their daily experience at sea.
With this goal, bottom trawl fishers with good knowledge of the fishing grounds around the
Balearic Islands were consulted.
Discussion
The total list of 19 species previously selected (Table 1), based on the criteria of being under size
regulation or having important commercial interest, was analyzed in the case of fishery dependent
data. However, the following four species could not be analyzed with fishery independent data
owing to limitations in the sampling scheme: the fish Mullus barbatus and the crustaceans
Aristeus antennatus, Nephrops norvegicus and Parapenaeus longirostris. In the case of M.
barbatus and P. longirostris, two species with size regulation, the low number of individuals taken
in the study area prevents analyzing spatiotemporal variations in their populations. The situation
is different for A. antennatus and N. norvegicus, two crustacean species abundant in the study area
but which undersized population fraction (MLS or L50) are taken in such a small number that it
also prevents the analyses.
Fishery independent data: MEDITS surveys
For each species, maps of population density (number of individuals per Km2) and hotspot
persistence (in percentage of years) were elaborated for individuals under and over the MLS (if
applicable) and the L50. That is, eight maps (4x MLS plus 4x L50) for the species regulated by legal
size and four maps (4x L50) for those species without size regulation. A single example of one
species of each case is shown in this section: a fish having MLS (hake, Merluccius merluccius) and
a skate without MLS (thornback ray, Raja clavata). The maps of all species analyzed with fishery
independent data are in Annex 1.
Figure 4 shows the density (above) and persistence (below) maps of hake. Density maps of
immature individuals (<32.7 cm) of hake revealed two elongated, narrow areas of high density
along the 200 m isobaths in the southwest and northeast (in this case, with some spots at
shallower grounds) of Mallorca. Hotspots for mature individuals revealed the same two main
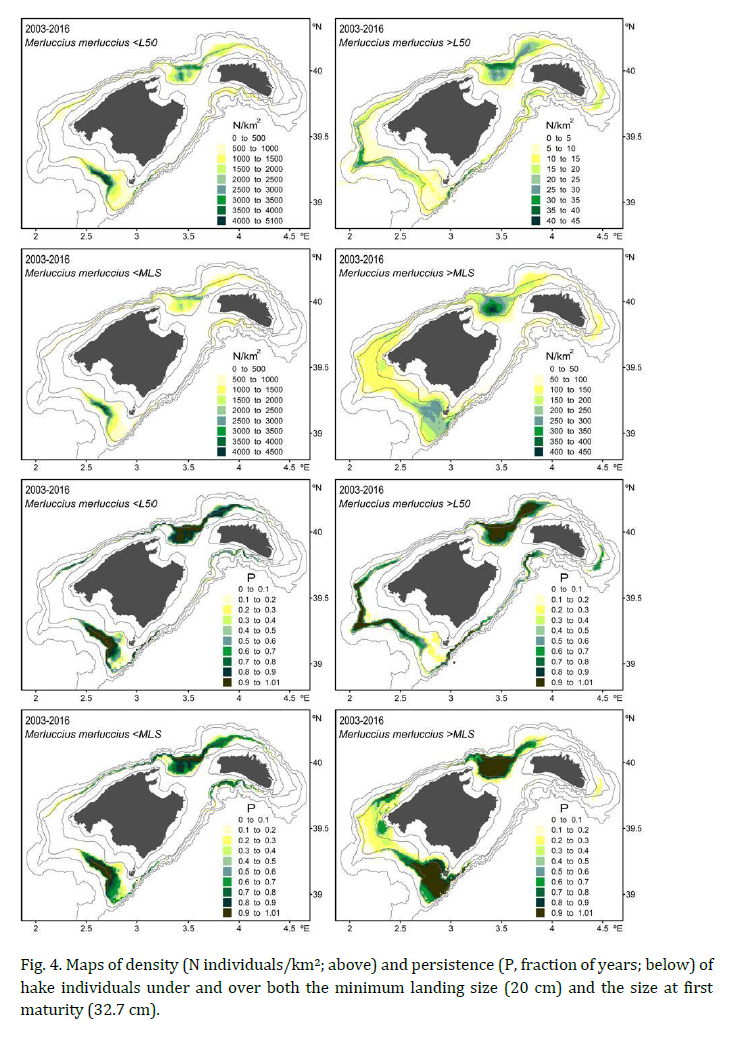
Figure 5 shows the density (above) and persistence (below) maps of the thornback ray. The
density maps showed that the species is caught all around the Balearic Islands but at low densities,
with the only exception of some areas that changed between juveniles and adults. In the case of
juveniles, hotspots were located along the north coast of the Menorca Island and a well defined
spot in the west coast of Mallorca. Hotspots of adults extended around Menorca (except the west
coast) whereas in Mallorca there is only a spot of slightly higher density than the adjacent areas
in the south coast.
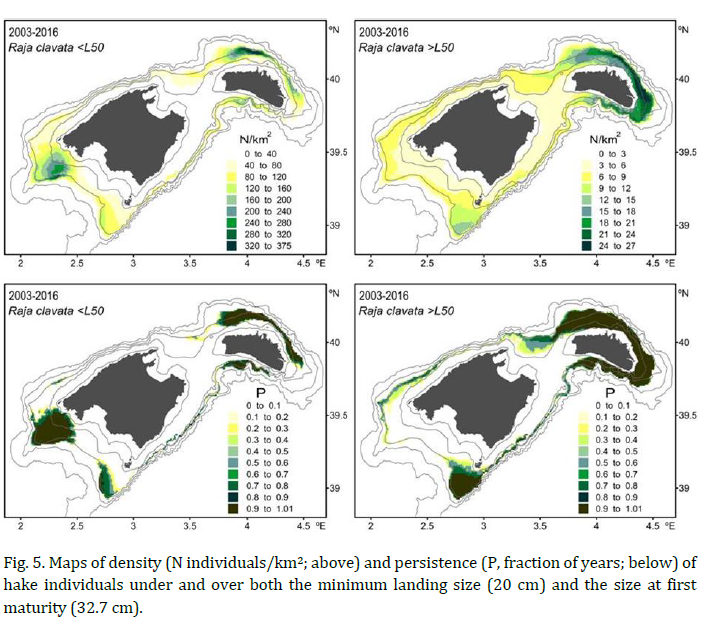 The persistency maps of the skate showed hotspots for juveniles in two areas of Mallorca (west
coast between 50 and 200 m, and south coast around the 200 m isobath) and along the north and
south coast of Menorca. Areas of high persistency for adults were found along Menorca (except
the west coast) and along the 200 m isobaths of Mallorca (except the southwest coast) and notably
in a large area between the 200 and 500 m depth in the south.
The persistency maps of the skate showed hotspots for juveniles in two areas of Mallorca (west
coast between 50 and 200 m, and south coast around the 200 m isobath) and along the north and
south coast of Menorca. Areas of high persistency for adults were found along Menorca (except
the west coast) and along the 200 m isobaths of Mallorca (except the southwest coast) and notably
in a large area between the 200 and 500 m depth in the south.
The species overlap among the species analyzed in this study considering their corresponding L50
and four levels of persistence (0.5, 0.6, 0.7 and 0.8) are shown in Figure 6. Overlap between two
Outputs
Decision support tools
Task 4.3 was aimed at providing maps of commercial catch operations to allow fishers to make
choices of fishing location that avoid discards and provide decision support tools to assist fishers
in those choices. In accordance with these aims, the maps and rest of information analysed in this
work was presented in a web application developed with Shiny (https://shiny.rstudio.com/),
which is an R package to build interactive web apps straight from the software R (https://www.r-
project.org/).
The Shiny web developed to synthesize these results is structured in different tabs, according to
the two data sources used in the analyses: the survey data and the onboard observers’ data.
The Survey data tab displays the maps elaborated from data gathered during the MEDITS surveys.
It is organized in three sub-tabs, including a general map showing all sampling stations (Map tab)
and the maps obtained considering both the L50 (Discards tab) and the MLS (Maturity tab).
The Observer’s data tab, which displays the outputs obtained analyzing data collected onboard
commercial vessels, is organized in four sub-tabs. It contains the same three groups as the Survey
data tab (Map, Discards and Maturity tabs) together with a new one with the length frequency
distribution of the catches by fishing ground and species (Length frequency tab). In this case,
however, the Discards and Maturity tabs do not display the information in maps but using graphs
of density (number of individuals/effective hour of trawling) of individuals under and above the
MLS and the L50. These two tabs are structured in four different sub-tabs showing general results
(Discard ratio tab) along with seasonal (Seasonal variability tab) and interannual variations
(Inter-annual variability tab) and a table with the data (Summary tab).
The Species' Info tab provides a table with the MLS and the L50 for the species included in the
analysis. It also provides links to other websites with general information on the biology and
ecology of the species.
Finally, the About tab contains general information about the DiscardLess project and the
development of this Shiny app.
In accordance with the main aim of providing decision support tools to assist fishers to make
choices of fishing location to avoid discards, the following Shiny app, which contains all the results
obtained in this work, were developed: https://lucia2r.shinyapps.io/prueba_nolog/.
Figure 13 is a snapshot of the home page displaying the different tabs described above: Observer’s
data, Survey Data, Species’ Info and About. In this example, the snapshot shows the specific case
of the Observer’s data tab, which contains the following sub-tabs (also available for the Survey
Data tab): Map, Length Frequency, Discards and Maturity. On the left hand side there appear the
dropdowns to choose the species and the fishing grounds to be shown. As it is shown below the
dropdowns, only those fishing grounds containing a number of sampling stations higher than 25
were used in the analyses.
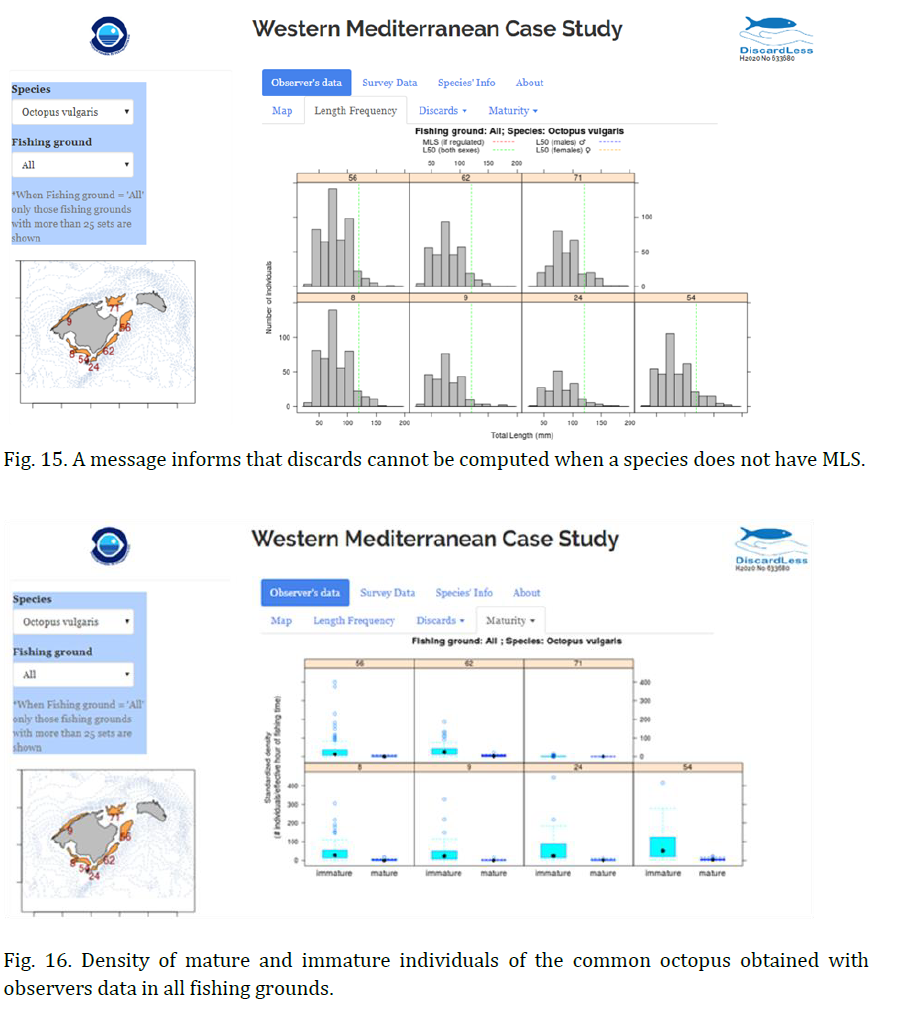
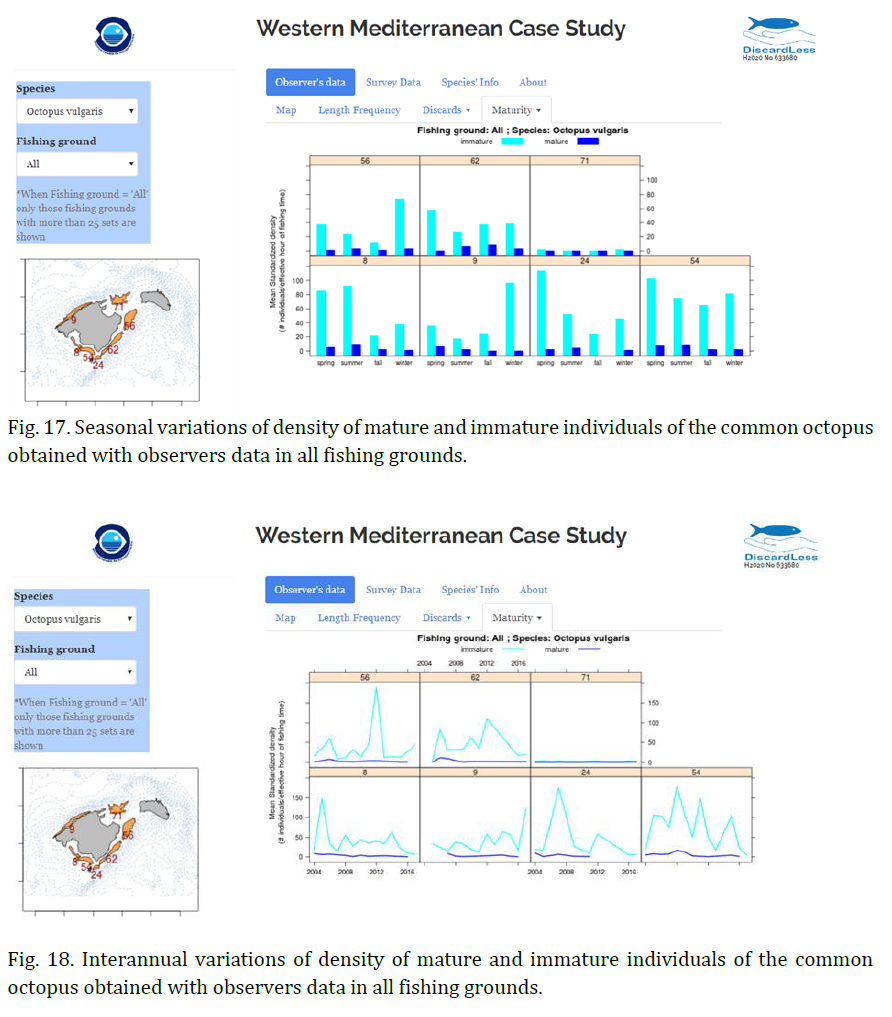
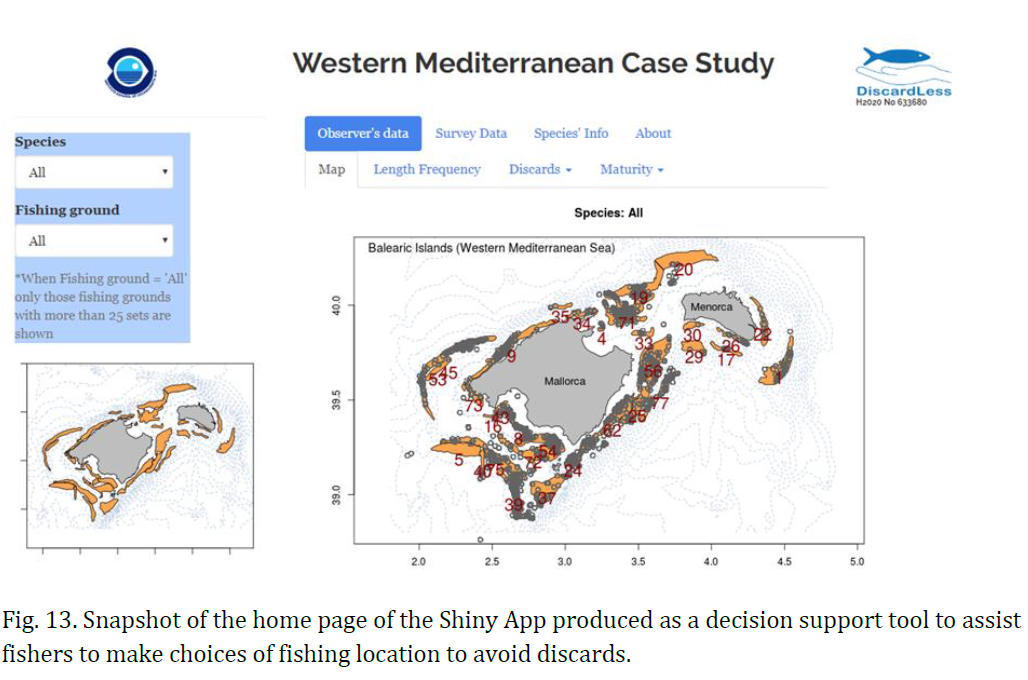 Figure 14 shows an example of a species that does not have MLS, in this case the common octopus
(Octopus vulgaris) taken by commercial trawlers (Observer’s data tab). The snapshot shows the
population structure of this species for all fishing grounds where the species was caught (sample
size >25) under the Length Frequency tab. As this species does not have MLS, the Discards tab
does not contain graphs but only a message informing about this (Fig. 15). In this case, only graphs
considering the MLS can be produced showing the information for immature and mature
individuals: total (Fig. 16), seasonal (Fig. 17) and interannual (Fig. 18) variability in species
density (number of individuals per hour of trawling).
Figure 14 shows an example of a species that does not have MLS, in this case the common octopus
(Octopus vulgaris) taken by commercial trawlers (Observer’s data tab). The snapshot shows the
population structure of this species for all fishing grounds where the species was caught (sample
size >25) under the Length Frequency tab. As this species does not have MLS, the Discards tab
does not contain graphs but only a message informing about this (Fig. 15). In this case, only graphs
considering the MLS can be produced showing the information for immature and mature
individuals: total (Fig. 16), seasonal (Fig. 17) and interannual (Fig. 18) variability in species
density (number of individuals per hour of trawling).
 The Species' Info tab (Fig. 19) provides a table with the MLS and the L50 for the species included
in this work. It also provides links to other websites with general information on the biology and
ecology of the species. Finally, the About tab contains general information about the DiscardLess
project and the development of this Shiny app (Fig. 20).
The Species' Info tab (Fig. 19) provides a table with the MLS and the L50 for the species included
in this work. It also provides links to other websites with general information on the biology and
ecology of the species. Finally, the About tab contains general information about the DiscardLess
project and the development of this Shiny app (Fig. 20).
References
Barry S.C., Welsh A.H. 2002. Generalized additive modelling and zero inflated count data.
Ecological Modelling 157: 179-188.
Bertrand J.A., de Sola L.G., Papaconstantinou C., et al. 2002. The general specifications of the
MEDITS surveys. Sci. Mar. 66: 9-17.
Borchers D.L., Buckland S.T., Priede I.G., et al. 1997. Improving the precision of the daily egg
production method using generalized additive models. Can. J. Fish. Aquat. Sci. 54: 2727-
2742.
Colloca F., Cardinale M., Belluscio A., et al. 2003. Pattern of distribution and diversity of demersal
assemblages in the central Mediterranean sea. Estuarine Coastal and Shelf Science 56:
469-480.
Colloca F., Garofalo G., Bitetto I., et al. 2015. The Seascape of Demersal Fish Nursery Areas in the
North Mediterranean Sea, a First Step Towards the Implementation of Spatial Planning for
Trawl Fisheries. Plos One 10: e0119590.
Farriols M.T., Ordines F., Somerfield P.J., et al. 2017. Bottom trawl impacts on Mediterranean
demersal fish diversity: Not so obvious or are we too late? Continental Shelf Research 137:
84-102.
Glavic K., Dobroslavic T., Bartulovic V., et al. 2014. The Reproductive Biology of Forkbeard, Phycis
phycis (Linnaeus, 1766) (Phycidae) in the Adriatic Sea (Croatia). Turkish Journal of
Fisheries and Aquatic Sciences 14: 165-171.
Guijarro B., Gonzalez N., Rubio V. 2013. Population dynamics, biology and state of exploitation of
the Norway lobster (Nephrops norvegicus) in the Balearic Islands. Rapp. Comm. int. Mer
Médit. 40: 562.
Guijarro B., Massuti E. 2006. Selectivity of diamond- and square-mesh codends in the deepwater
crustacean trawl fishery off the Balearic Islands (western Mediterranean). ICES J Mar Sci
63: 52-67.
Guijarro B., Massuti E., Moranta J., et al. 2009. Short spatio-temporal variations in the population
dynamics and biology of the deep-water rose shrimp Parapenaeus longirostris (Decapoda:
Crustacea) in the western Mediterranean. Sci. Mar. 73: 183-197.
Guijarro B., Massut+¡ E., Moranta J., et al. 2008. Population dynamics of the red shrimp Aristeus
antennatus in the Balearic Islands (western Mediterranean): Short spatio-temporal
differences and influence of environmental factors. J. Mar. Syst. 71: 385-402.
Mannini P., Reale B., Righini P. 1990. Osservazioni sulla biologia e la pesca di Lepidorhombus
boscii(Risso) (Osteichthyes, Scopthalmidae) nel tirreno settentrionale. Oebalia 16: 245-
255.
Marra G., Wood S.N. 2011. Practical variable selection for generalized additive models.
Computational Statistics & Data Analysis 55: 2372-2387.
Massuti E., Renones O. 2005. Demersal resource assemblages in the trawl fishing grounds off the
Balearic Islands (western Mediterranean). Sci. Mar. 69: 167-181.
Moranta J., Quetglas A., Massuti E., et al. 2008. Research trends on demersal fisheries
oceanography in the Mediterranean. In: Mertens L.P. (ed), Biological Oceanography
Research Trends. Nova Science Publishers, Inc., New York, pp. 9-65.
Oliver P. 1993. Analysis of fluctuations observed in the trawl fleet landings of the Balearic Islands.
Sci. Mar. 57: 219-227.
Ordines F., Massuti E., Guijarro B., et al. 2006. Diamond vs. square mesh codend in a multi-species
trawl fishery of the western Mediterranean: effects on catch composition, yield, size
selectivity and discards. Aquat. Living Resour. 19: 329-338.
Palmer M., Quetglas A., Guijarro B., et al. 2009. Performance of artificial neural networks and
discriminant analysis in predicting fishing tactics from multispecific fisheries. Can. J. Fish.
Aquat. Sci. 66: 224-237.
Peirano A., Tunesi L. 1986. Preliminary notes on the biology of Helicolenus dactylopterus
(Delaroche, 1809) in the Ligurian Sea. Rapp. Comm. int. Mer Médit. 30: 233.
Ramirez-Amaro S., Ordines F., Terrasa B., et al. 2016. Demersal chondrichthyans in the western
Mediterranean: assemblages and biological parameters of their main species. Mar.
Freshwater. Res. 67: 636-652.
Velasco E.M., Jimenez-Tenorio N., Del Arbol J., et al. 2011. Age, growth and reproduction of the
axillary seabream, Pagellus acarne, in the Atlantic and Mediterranean waters off southern
Spain. J. Mar. Biol. Assoc. U. K. 91: 1243-1253.
Wood S.N. 2006. Generalized Additive Models: An Introduction with R. CRC Press Taylor & Francis
Group, 392 pp.
Citation :
Fiche Maps of discards based on survey and onboard observers / Balearic Islands, Author(s) : Antoni Quetglas, Francesc Ordines, Lucía Rueda and Enric Massutí - IEO
DiscardLess (2018) : Tools to help strategy modification to decrease discards amount.